Arpit Panwar

I am seeking a new journey in the field of Data Science where I get exposure to real-world problems and an understanding of business using data. I am currently exploring visualization tools such as PowerBI and different python libraries.
View My LinkedIn Profile
View My Kaggle Profile
My Data Analytics Portfolio
Projects
Highway Toll Leakage & Revenue Loss
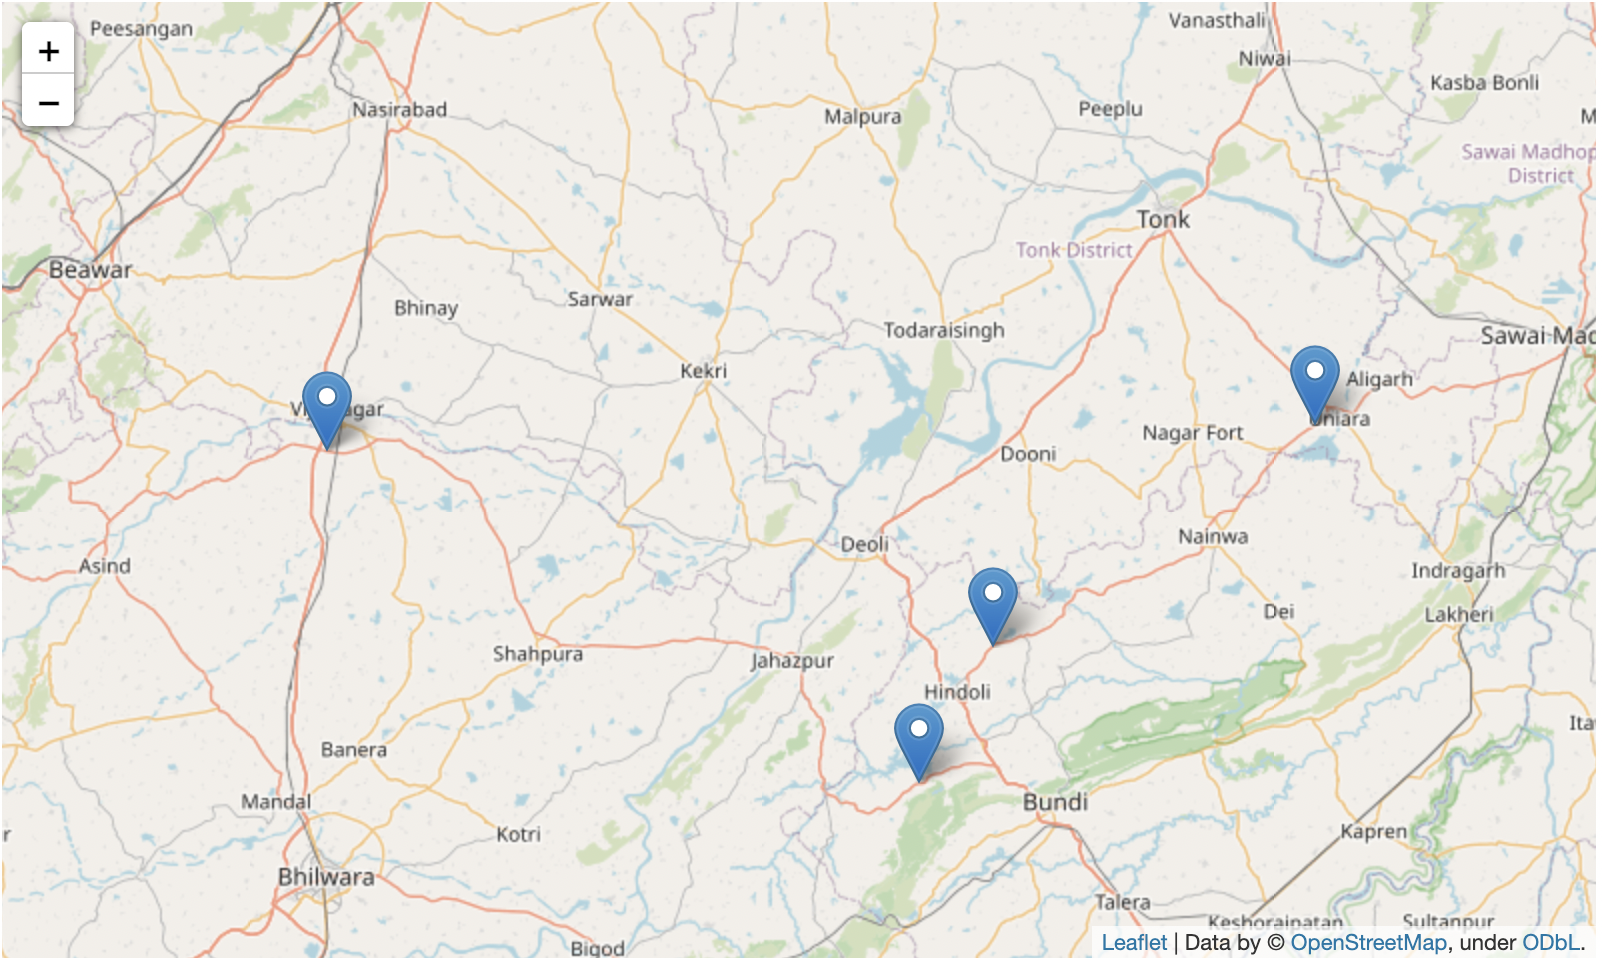
 Based on toll transactions of 4 tolls and various details about tolls such as Coordinates, Price, etc I calculated the revenue lost because of vehicles skipping tolls
Bangalore House Price Predictor
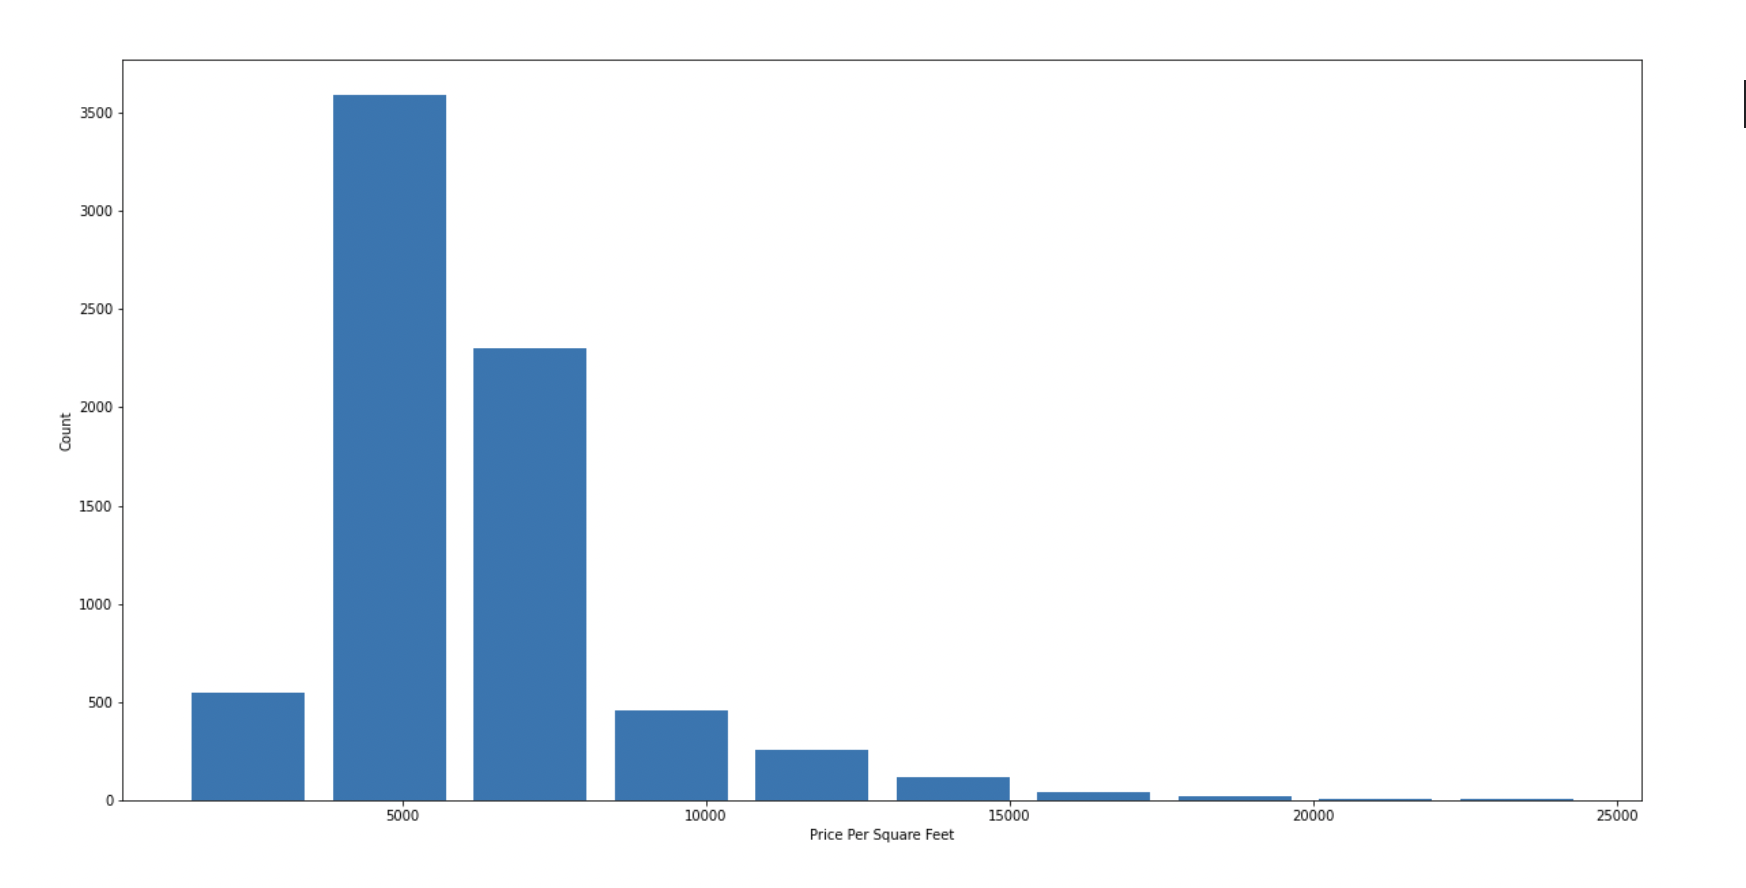
 Bangalore being called the silicon valley of India and has houses with different price ranges. So, I predicted the price of houses using factors like location, size, total sq ft, etc where I tried a different algorithm and got the maximum accuracy of 82% using Linear regression.
PC Hardware Sales Insights
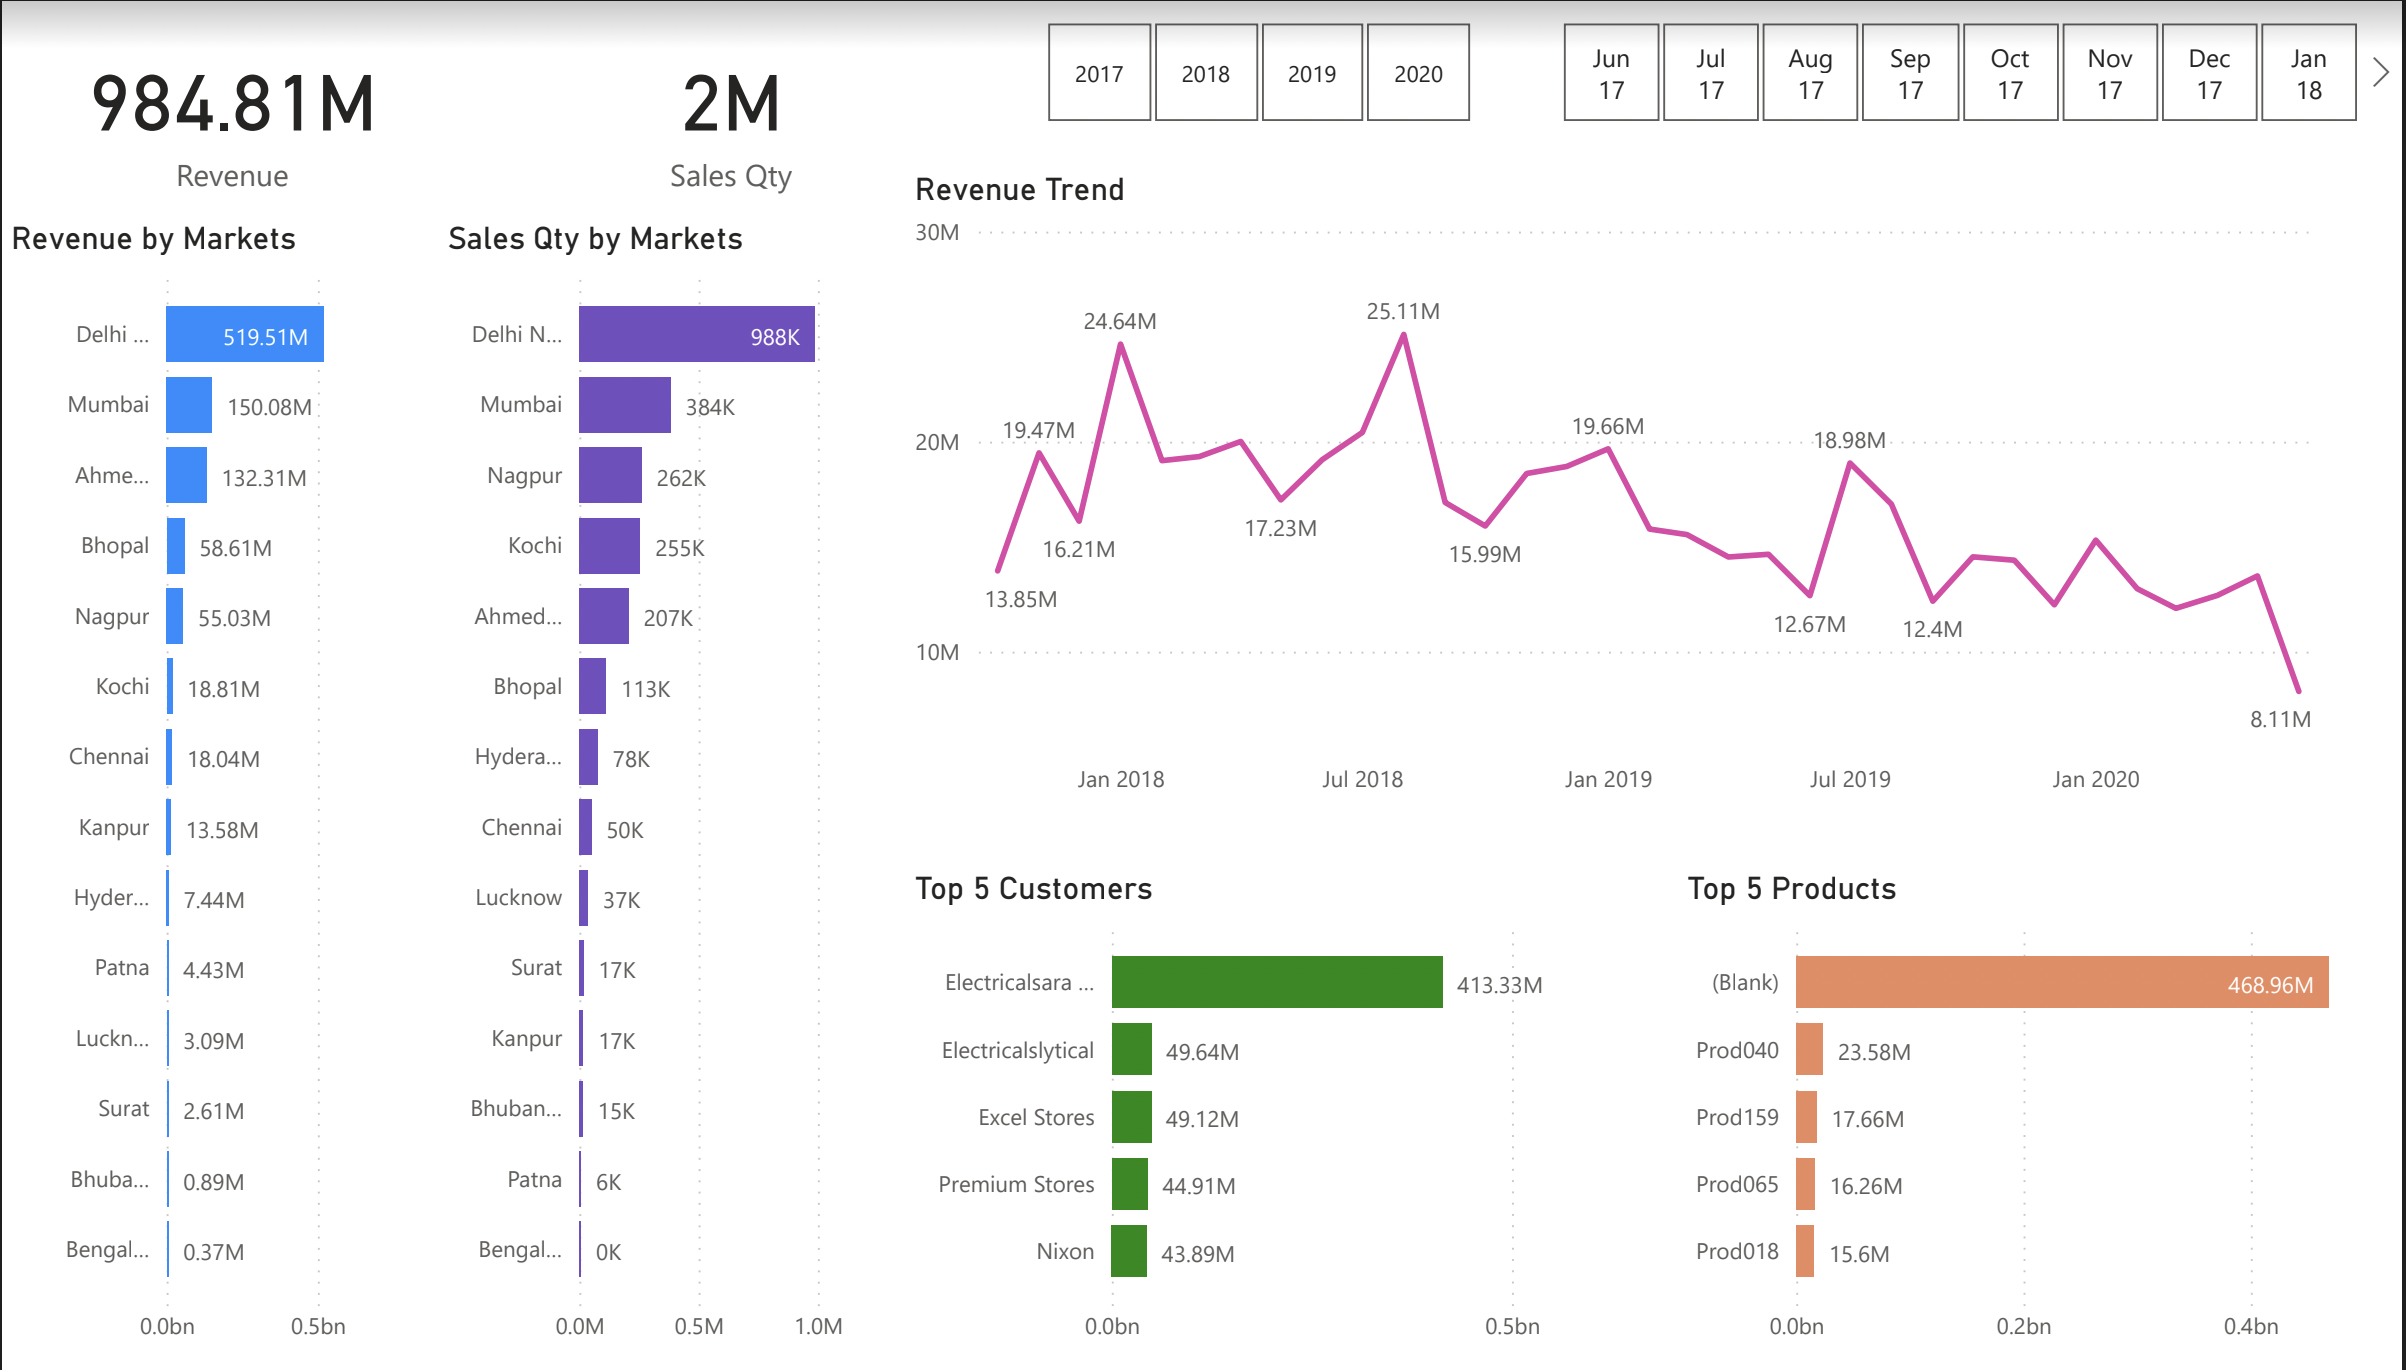
 After cleaning and manipulating data using power query, I created a dashboard for the following criteria:
Top 5 revenue-generating products and customers.
Revenue trend for the last 4 years.
Distribution of revenue and sales quantity across different market zones.
Fifa 22 Data Exploration
 After cleaning and manipulating the data, I analyzed the data for the following points:
Compared the 2 best defenders and their skillset
Discovered the next best player with great potential and are very young (age<19)
Looked at the distribution of top 100 players across Countries, Clubs and Leagues.
Projects Listed
- Highway Toll Leakage & Revenue Loss
- Bangalore House Price Predictor
- PC Hardware Sales Insights
- Fifa 22 Data Exploration
- Bike Sales Data Analysis
- Loyalty Points